Summary: Drug Clinical Trials
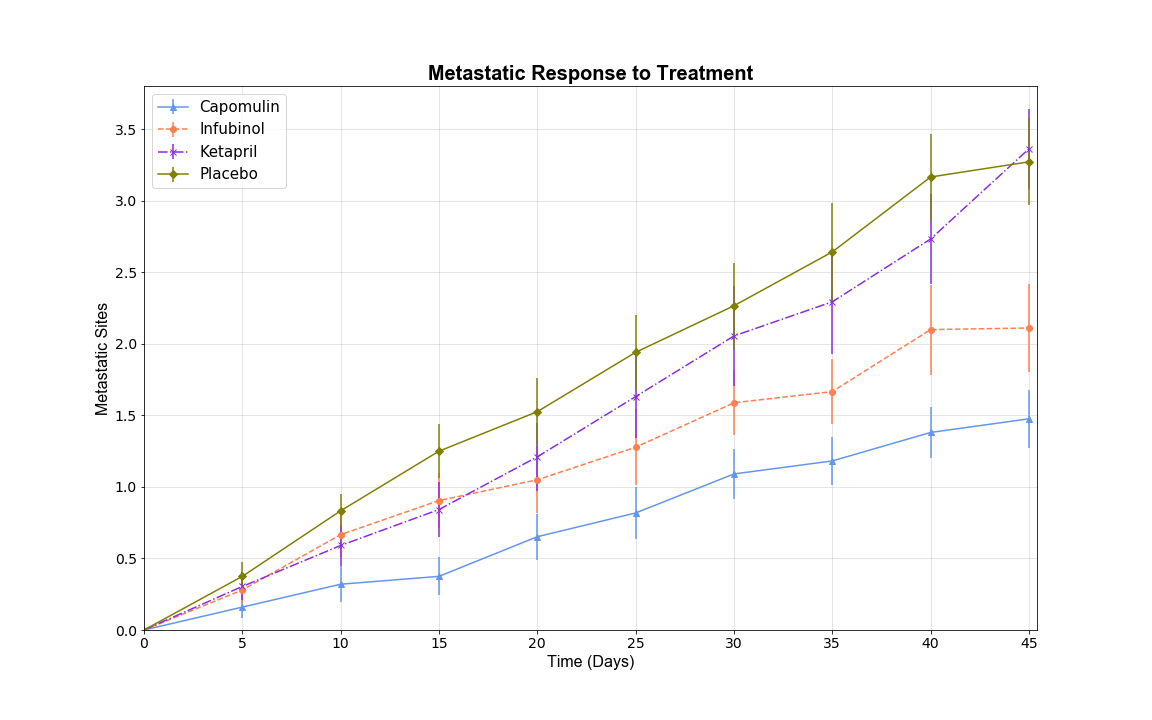
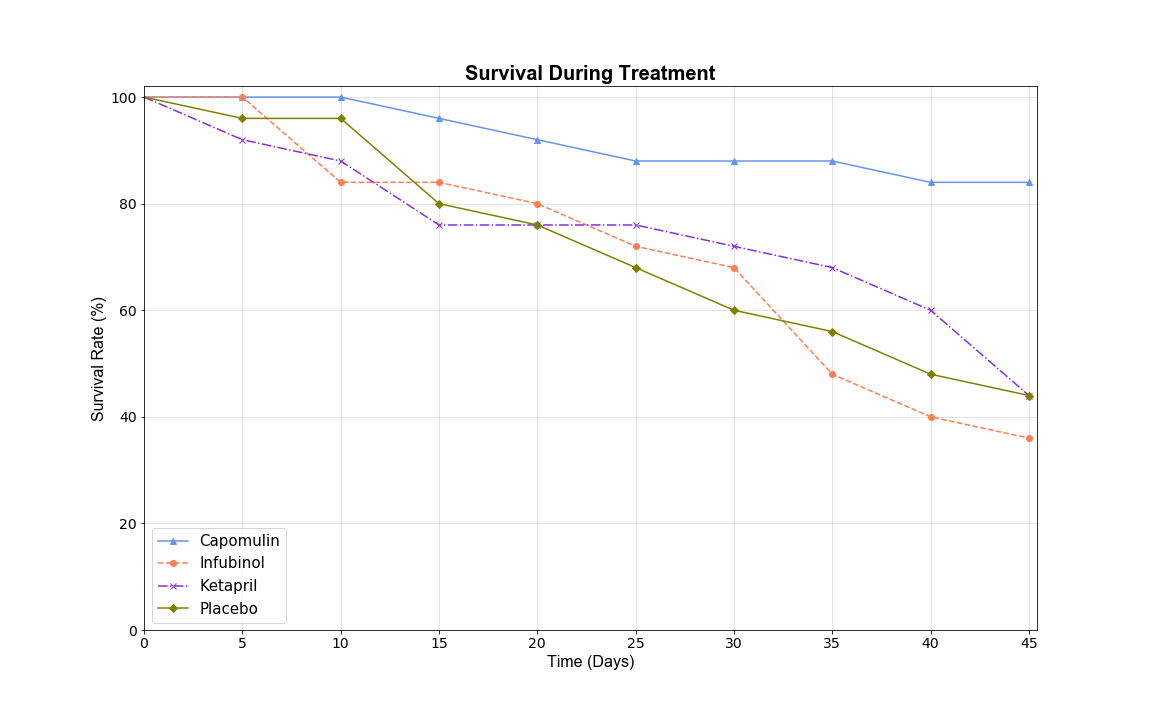
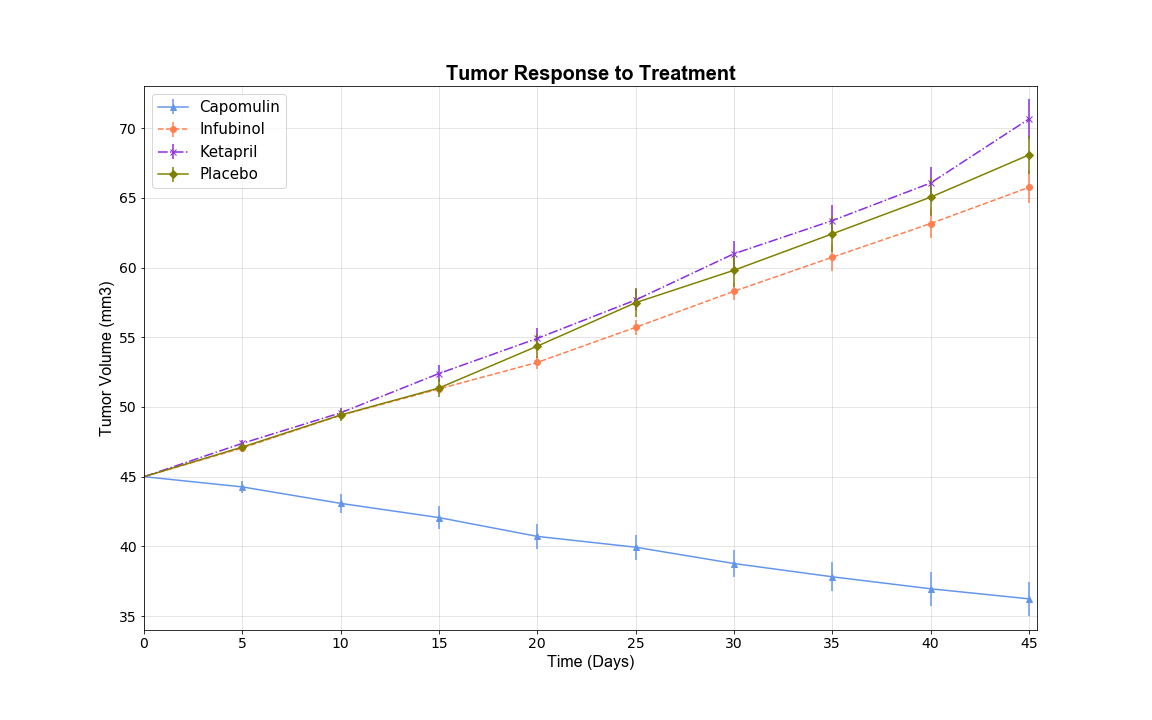
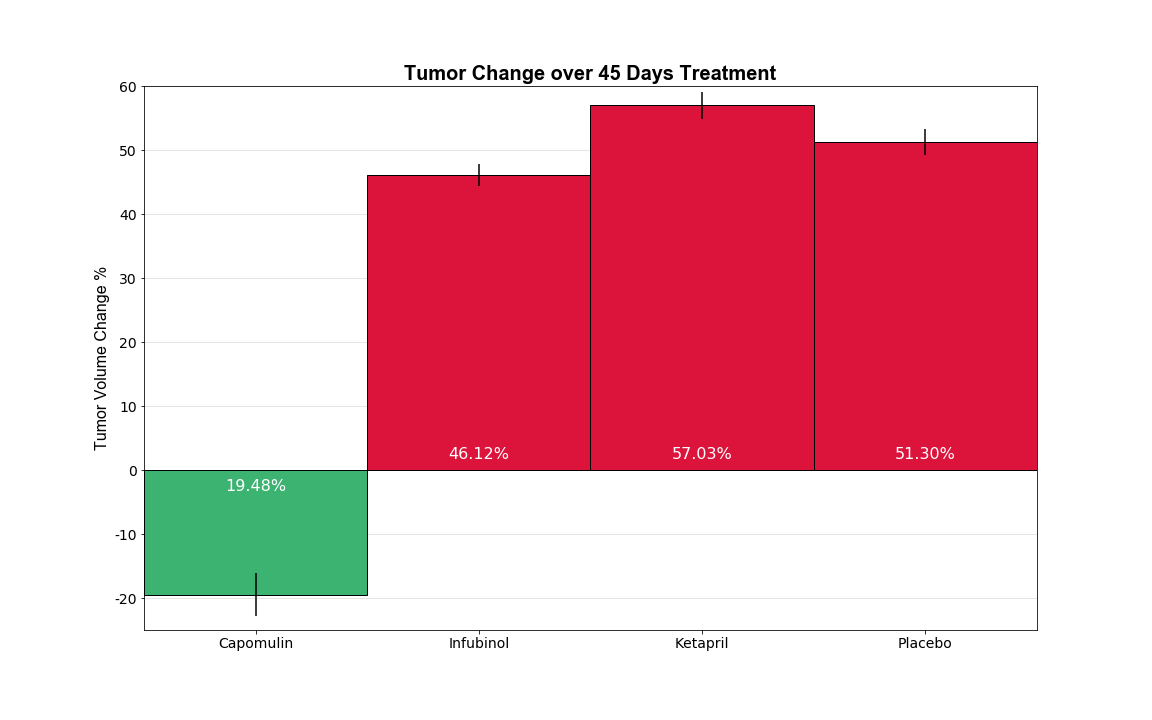
The clinical study were performed to test 3 new anti-cancer drug-based treatments. During these studies, 250 mice were treated through a variety of drug regimes over the course of 45 days. Their physiological responses were then monitored over the course of that time.
Raw data was stored in two CSV files: one for the list of mice and the treatment they've received, another one for the data on metastatic sites count and tumor volume over period of time. The data can be found on the Data page
The analysis of the data was done using Python and pandas library. The visualizations were built using matplotlib library.
The visualizations section has links to all research items together with the conclusions made based on the chart. The Comparison page contains all the visualizations side-by-side
Visualizations